What you'll learn
Key ideas from The Data Detective
These ideas compress the book's argument without treating the author's view as settled fact. Use them as an orientation before reading the full work or listening in Wiseley.
Asking where a number came from, what it compares, and what else could explain it helps assess a statistical claim.
Emotions and social belonging shape how evidence is read and expressed; pausing can reveal their influence without guaranteeing objectivity.
When rewards attach to a proxy, organizations may change processes to improve the metric without establishing that the underlying outcome improved.
Baselines, simple arithmetic, and longer time spans make dramatic numbers easier to interpret.
The full research record includes attempts that failed to confirm a result, not only studies that made it into view.
A large sample cannot compensate for systematic gaps in coverage or response.
Useful predictions depend on a clear target, sound inputs, and performance that holds beyond the conditions where a model first succeeded.
Superforecasting combines base rates, case details, scorekeeping, breaking questions into parts, and updating as evidence arrives.
Inside The Data Detective
Read the first chapter in full here. The other 13 continue in the Wiseley app.
Chapter 1 of 14 · 5 min · Audio & text
From Cynicism to Curiosity
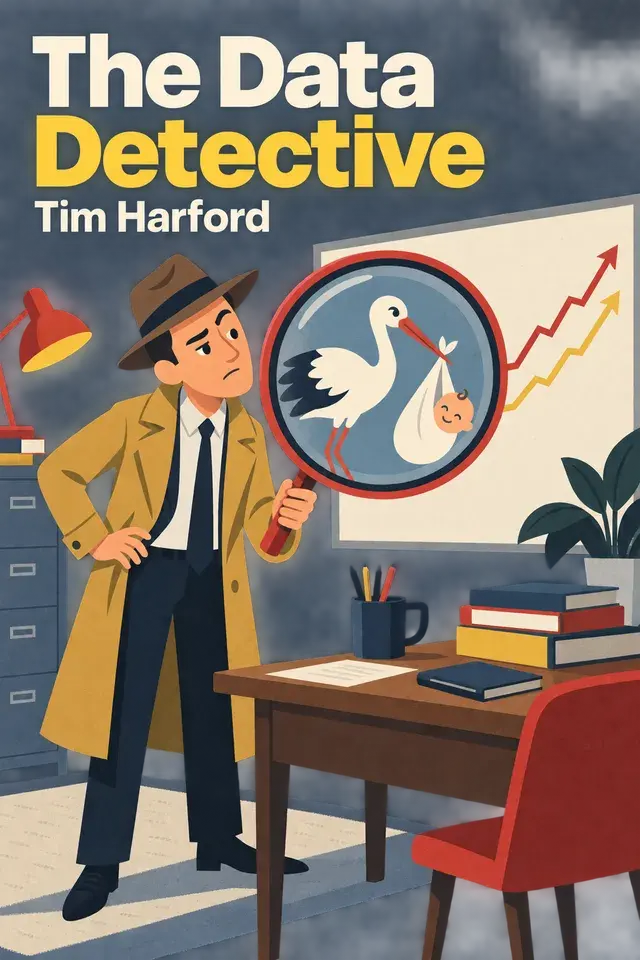
The Data Detective, by Tim Harford.
Numbers can be abused, and that fact invites an appealing shortcut: assume a statistic is a trick and stop listening. But cynicism leaves us as vulnerable as gullibility. If every number is dismissed, we lose a way to see patterns too large or subtle for ordinary observation. The task is to ask how a statistic was made and what it can actually show.
A striking example is the relationship between storks and babies. Comparisons among countries found that more storks went with more births. The association was strong enough to pass a conventional publication threshold and was described as statistically significant. Yet larger countries have more people, so they have more births and more storks. Country size offers an alternative explanation for the pattern. The numbers show that the two variables move together; they do not show that storks cause births. A correlation can be accurate and impressive while the causal story built from it is wrong.
The rise in lung cancer presented a more consequential puzzle. Motorcars and road tar also became more common, offering a plausible explanation for the increase. To move beyond coincidence and speculation, Doll and Hill compared people with lung cancer to patients of similar sex and age at the same hospital. They asked about the patients’ histories rather than relying on anecdotes or a single proposed cause. Their initial study found that heavy cigarette smoking made lung cancer sixteen times more likely. Doll stopped smoking after seeing the result.
Doll and Hill then followed a much larger group of doctors. They contacted all 59,600 doctors in the United Kingdom, and more than 40,000 responded. Doctors made useful subjects for a long-term study because their smoking could be tracked and their causes of death diagnosed. Over time, the evidence supported the conclusion that smoking causes lung cancer, that greater consumption raises the risk, and that smoking also causes heart attacks. The case shows statistics used as patient investigation: define relevant groups, compare them, and follow outcomes long enough to learn more.
That evidence did not stop tobacco companies from trying to weaken it. Their executives challenged studies and funded distracting research. Rather than demonstrate that cigarettes were safe, they exploited unresolved questions to make the evidence seem less settled than it was. The book reports that, at a 1965 Senate hearing, Darrell Huff used the storks example to argue that the evidence linking smoking and disease was no more convincing than the idea that storks deliver babies. It also reports that the tobacco lobby had paid him. The example shows how a genuine warning about correlation can be turned into a tool for manufactured doubt.
Early COVID-19 presented a different problem: genuine uncertainty from incomplete data. During the crisis’s early stages, politicians faced urgent decisions while epidemiologists, medical statisticians, and economists worked with information that was patchy and inconsistent. Testing was scarce and concentrated among medical staff, critically ill patients, and the wealthy or famous. The available numbers could not reliably show how many mild or asymptomatic cases there were, or the virus’s true fatality. Decision-makers also had to weigh health risks against severe economic consequences. This early account describes open questions and plausible scenarios, not settled conclusions. Missing or uneven data made uncertainty real; it did not make statistics useless.
A first method is to ask where a number came from, who was counted, what it compares, and what alternative explanation could fit. Country size helps explain the storks-and-babies association. Doll and Hill’s matched comparisons and follow-up made their evidence about smoking more informative. When information is incomplete, say what cannot yet be known. Curiosity keeps the inquiry open, while skepticism asks that each claim stay within what the evidence can support.
Chapter 2 of 14 · 5 min · Audio & textIn the app
Notice What You Want to Believe
The evidence hardest to judge fairly is often evidence tied to something we hope is true. Knowledge and careful attention can help us interpret a claim, but they can also give us more ways to defend the conclusion we want.
Chapter 3 of 14 · 6 min · Audio & textIn the app
Put Experience in Its Place
A low occupancy statistic can sit beside a genuinely crowded commute. It is tempting to decide that either the data are wrong or the passenger’s experience is misleading.
Chapter 4 of 14 · 7 min · Audio & textIn the app
Define the Count First
A statistic can be arithmetically exact and still leave its central question unanswered: what, precisely, has been counted? Harford calls the rush to calculate before settling that meaning “premature enumeration.”
Chapter 5 of 14 · 5 min · Audio & textIn the app
Step Back for Perspective
Once the measure is defined, the next question is what comparison gives it meaning. A number can be exact and still create a distorted impression when detached from a useful baseline, time span, or scale.
Chapter 6 of 14 · 6 min · Audio & textIn the app
Read the Research Record
A published result can be real, carefully conducted, and still tell only part of the story. The trouble begins when we see a striking success and mistake it for a settled pattern.
Chapter 7 of 14 · 8 min · Audio & textIn the app
How False Certainty Gets Published
A research result can look convincing without anyone committing fraud. Ordinary decisions about what to measure, when to stop collecting data, and which results to report can make chance patterns appear meaningful.
Chapter 8 of 14 · 9 min · Audio & textIn the app
Ask Who Is Missing
A dataset can be large, carefully counted, and still leave out people whose experiences matter. The gap may come from who was invited, who answered, or what questions were asked.
Chapter 9 of 14 · 7 min · Audio & textIn the app
Big Data Still Needs Theory
Big data promised a simple advantage: computers could gather traces continuously and inspect them quickly, perhaps spotting changes before slower measures did. But a system can count every record it produces without containing every person or event it claims to represent.
Chapter 10 of 14 · 8 min · Audio & textIn the app
Open Algorithms to Scrutiny
Arguments about automated decisions often begin with a verdict: machines are objective, or machines are dangerous. A more useful question is how well a particular system performed at a particular task, compared with the real alternatives.
Chapter 11 of 14 · 6 min · Audio & textIn the app
Protect the Public Data Bedrock
Public statistics give a country common ground for discussing what is happening and what to do. Counts of people, jobs, prices, health, and public spending help governments plan.
Chapter 12 of 14 · 7 min · Audio & textIn the app
Read the Chart’s Argument
A chart can bring a pattern into focus at a glance. That speed is useful, but it can also make an interpretation feel obvious before we ask what the picture measures.
Chapter 13 of 14 · 6 min · Audio & textIn the app
Update When Facts Change
Forecasting asks us to say what we think will happen before we know. Good judgment then depends on what we do when evidence arrives.
Chapter 14 of 14 · 6 min · Audio & textIn the app
Curiosity as a Daily Practice
The book’s rules are best treated as habits, not commandments. Before accepting or dismissing a number, ask what it means and how it was produced.
Chapter 1 of 14 · 5 min · Audio & text: From Cynicism to Curiosity
Wiseley supports reading and listening to summaries in the app.
Continue in WiseleyAbout Tim Harford

Tim Harford is a British economic journalist. “The Data Detective” explores how to judge numerical claims without falling into gullibility or blanket distrust.
Explore more books by Tim Harford