What you'll learn
Key ideas from How to Make Money in Stocks
These ideas compress the book's argument without treating the author's view as settled fact. Use them as an orientation before reading the full work or listening in Wiseley.
Its seven questions cover earnings, what is new, share supply and demand, leadership, institutional sponsorship, and market direction.
Charts record price and volume as evidence of supply and demand, and recurring patterns reflect persistent crowd behavior.
Sales growth, recurring earnings, dilution, margins, ROE, and stability help show whether reported EPS gains are durable.
Industry leadership is relative: the strongest performer in a field can matter more than a larger, familiar company or a cheaper follower.
Daily price and volume in several major averages provide the primary evidence of broad market direction.
O’Neil’s usual maximum loss is 7 to 8 percent below cost, while weaker behavior can justify an earlier exit.
The research sequence moves from market context to screening, rating checks, chart study, and a prepared watchlist.
Inside How to Make Money in Stocks
Read the first chapter in full here. The other 14 continue in the Wiseley app.
Chapter 1 of 15 · 3 min · Audio & text
Learning From Historical Winners
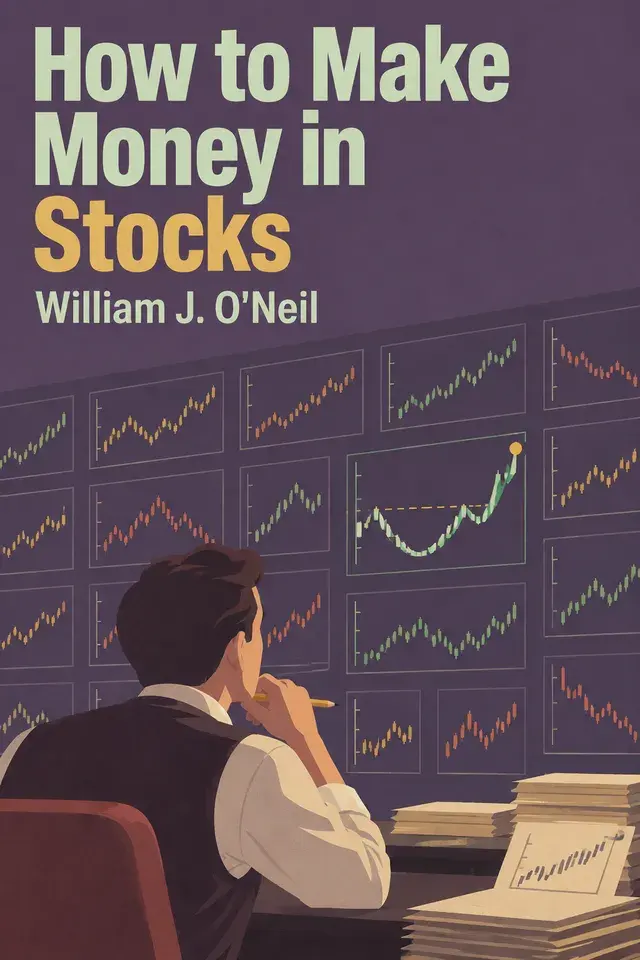
How to Make Money in Stocks, by William J. O'Neil.
How can an investor recognize a stock before it becomes an exceptional winner? O’Neil’s answer begins with historical comparison. He describes studying the stocks that made the largest percentage gains in each year across 125 years, then expanding the research to more than one thousand winners dating back to the 1880s. The aim was to find characteristics that tended to appear before major advances, rather than build a method around one memorable success or a personal hunch.
The recurring characteristics became CAN SLIM, a set of seven screening questions. C asks whether current quarterly earnings are strong. A asks whether annual earnings have grown substantially. N asks what is new, such as a product, management change, or a stock reaching new highs. S asks how supply and demand affect the shares. L asks whether the company is a leader or a laggard. I asks whether institutions are sponsoring the stock. M asks whether the general market’s direction is favorable. Together, the questions organize the kinds of evidence O’Neil found among past leaders.
The framework’s value lies in considering those clues together. The historical study compared company characteristics with the stocks’ price performance, including earnings, trading volume, relative strength, share supply, new products or management, and industry group strength. A large advance was not treated as evidence that any single measure explained success. The pattern of evidence across many winners supplied the framework’s starting point.
O’Neil also uses historical charts to show the scale and duration of the advances under study. He presents charts as records of how a stock actually performed, and argues that studying many winners helps investors recognize recurring patterns. In his account, price patterns recur because human nature and the forces of supply and demand persist. That is the basis for looking for similarities across different companies and periods, while remembering that a recurring pattern is a clue, not a promise that every stock will repeat a past move.
Two examples make the range vivid. Northern Pacific rose 1,181 percent in 29 weeks, according to the book’s historical chart. Yahoo! rose 6,723 percent in 130 weeks. These figures show why the author focused on major winners and on the characteristics visible before their advances. They also show that the gains varied greatly in both size and duration; CAN SLIM grew from a broad historical comparison, not from a claim that every winner follows one identical course.
This opening chapter establishes the method’s foundation. Studying past leaders can make their shared characteristics easier to identify, and CAN SLIM gives investors a consistent set of questions for doing so. The historical examples explain what kind of advance the framework seeks to investigate. The next step is to examine its individual clues more closely, with the understanding that the method is grounded in past evidence, not certainty about the future.
Chapter 2 of 15 · 7 min · Audio & textIn the app
Read Bases, Volume, and Pivots
A chart is a record of what price and trading volume have done. O’Neil treats price as the result of supply and demand, and volume as evidence of how much trading accompanied each move.
Chapter 3 of 15 · 5 min · Audio & textIn the app
Recognize Patterns That Fail
The cup-with-handle is only one kind of base. O’Neil describes other formations, each with its own shape and conditions.
Chapter 4 of 15 · 7 min · Audio & textIn the app
Measure Growth Before Valuation
Chart rules help identify when a stock may be ready to buy. This chapter adds a test of the company’s results.
Chapter 5 of 15 · 6 min · Audio & textIn the app
New Catalysts and Share Supply
With company quality established by the earlier earnings questions, O’Neil asks what could accelerate a business. A new product or service, a management change, or a favorable shift in industry conditions may do it.
Chapter 6 of 15 · 8 min · Audio & textIn the app
Find Leaders Across Industry Groups
A stock's leadership becomes clearer when it is compared with companies doing similar work. The largest or most familiar name in an industry may not be its strongest stock.
Chapter 7 of 15 · 11 min · Audio & textIn the app
Read the Market's Direction
A strong company or a well-formed chart cannot remove the risk created by a falling market. O’Neil treats broad market direction as part of every stock decision.
Chapter 8 of 15 · 5 min · Audio & textIn the app
Make Losses Small and Deliberate
A sound investment method does not require every decision to be right. O’Neil’s rule is to limit what a wrong decision can cost, so one mistake does not take away the capital and confidence needed to act again.
Chapter 9 of 15 · 8 min · Audio & textIn the app
Take Profits and Hold Leaders
Selling well involves avoiding two opposite mistakes: leaving a strong stock too soon, or staying after evidence shows its advance is weakening. O’Neil developed his rules through both errors.
Chapter 10 of 15 · 5 min · Audio & textIn the app
Manage Positions and Leverage
Managing a portfolio begins where individual trade decisions leave off. How many stocks to own, how much capital to commit, how closely to monitor positions, how long to hold them, and whether to borrow all affect account-level risk.
Chapter 11 of 15 · 7 min · Audio & textIn the app
Choose Other Vehicles Carefully
The book’s advice about investment vehicles follows the same risk-first idea as its stock guidance: an alternative is not automatically safer, simpler, or more profitable. Each has its own mechanics, and speculative choices should remain secondary to selecting sound investments.
Chapter 12 of 15 · 6 min · Audio & textIn the app
Turn Evidence Into a Routine
O’Neil treats stock research as a sequence of checks. First assess the general market, then screen for candidates, examine their fundamentals and ratings, study their charts, and keep a prepared watchlist.
Chapter 13 of 15 · 5 min · Audio & textIn the app
Build Wealth Through Mutual Funds
Mutual funds call for a different kind of discipline from individual-stock trading. A shareholder owns a slice of a professionally managed portfolio and shares in the combined results, for a fee.
Chapter 14 of 15 · 6 min · Audio & textIn the app
Rethink Institutional Portfolio Management
O’Neil turns from individual investors to the professional managers whose decisions shape large portfolios. He argues that their results depend on more than stock research: fund size, internal rules, and the way managers are judged can all narrow their choices.
Chapter 15 of 15 · 5 min · Audio & textIn the app
Apply the Rules, Learn From Errors
The book closes by turning attention from the next prediction to the decisions an investor can examine. O’Neil argues that experience alone does not guarantee improvement: without studying mistakes, people may keep repeating them.
Chapter 1 of 15 · 3 min · Audio & text: Learning From Historical Winners
Wiseley supports reading and listening to summaries in the app.
Continue in WiseleyWhat How to Make Money in Stocks is about
How can investors identify a likely market leader, choose a disciplined entry, and know when to exit? William J. O’Neil combines earnings and sales, new developments, industry and institutional leadership, chart patterns, and market direction into CAN SLIM. The book offers a practical framework for screening stocks, timing purchases, controlling losses, and learning from market history.